What is Shooting Star Candlestick Patterns?
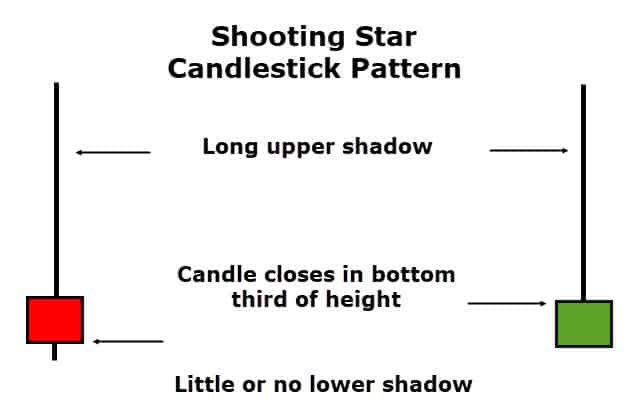
Shooting Star Candlestick Patterns is a bearish single candlestick pattern, and Shooting Star’s body texture is exactly opposite to that of the paper umbrella candle i.e. Hammer and Hanging Man, and that’s why it is called “INVERTED PAPER UMBRELLA”.
Also Read: How to Trade Morning Star Candlestick Pattern & Advance Day Trading Patterns for Beginners
How Shooting Star Candle Patterns is Formed?
A shooting star candle is formed when a stock is in UPTREND, and one day i.e. on the day of a shooting star, the stock goes above its own open price and creates another high price, which is in the BULLISH TREND of the stock.
But then on the same day, the number of sellers (BEARS) in the stock increases, and due to the activity from the BEARS side, the closing price of the stock becomes close to its open price, and thus a shooting star candle appears in the chart.

Identification of Shooting Star
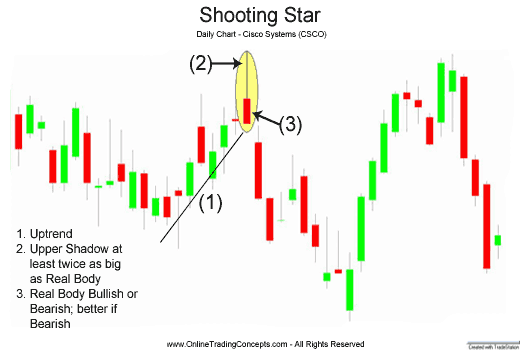
- Before becoming a Shooting Star, the stock should be in an uptrend.
- If we talk about the body of the Shooting Star candlestick patterns, then there is a small real body and a long upper shadow above it.
- The color of the candle is not important,
- The last trend of the stock is important which is uptrend, and the body of the candle should be in the ratio of 1:2 between small real body and long upper shadow.
- The REAL BODY of Shooting Star i.e. the OPEN PRICE and CLOSE PRICE of the candle should be a difference of 1% to 2%.
- The UPPER SHADOW of Shooting Star should be twice or more than the REAL BODY of that candle.

Effect of Shooting Star
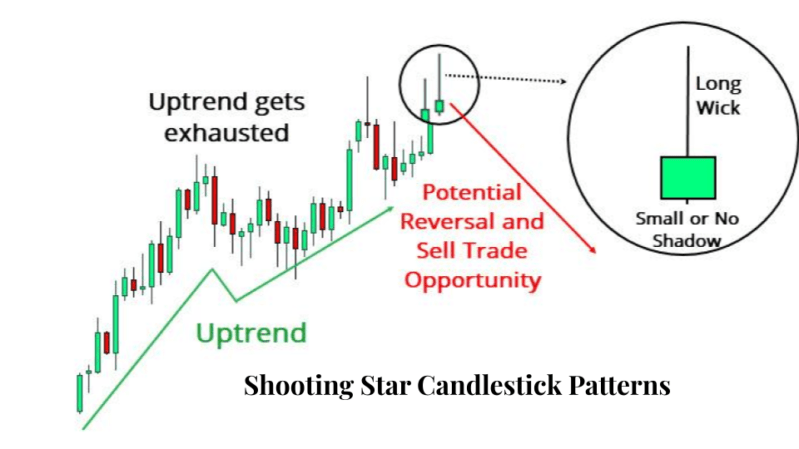
Let us now talk about what is the effect of a shooting star in the market, After Shooting Star appears in an uptrend, it is expected that now reversal can come, and the market which was going bullish till now can turn in to bearish now or change its direction from uptrend to downtrend.
What is the Benefit of Shooting Star?
- Shooting star indicate a potential price top and reversal.
- The shooting star candle is most effective when it forms after a series of three or more consecutive rising candles with higher highs.
- It may also occur during a period of overall rising prices, even if a few recent candles were bearish.
How to Trade Shooting Star?
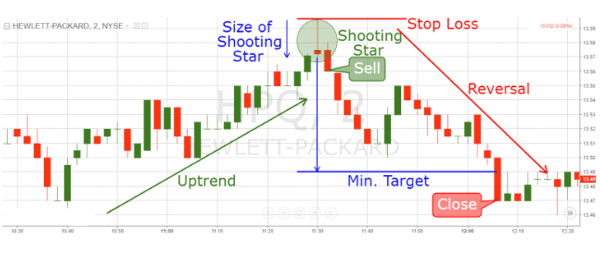
A shooting star is a bearish candle, therefore, we should place our short position over the shooting star candle, that is, we should sell stock and with strict stop loss and our target should be as per our risk-reward ratio and thus our trade set up above Shooting Star will remain like this.
TRADE SETUP – SHOOTING STAR
- If you are a risky trader then you can take immediate trade with Shooting Star candle confirmed, with the strict stop loss and if you are not a risky trader then you can wait for double confirmation i.e. after the Shooting Star candle is formed you can wait for a follow-up candle which should break the low of the shooting star candle then you can take trade together.
- Setup of trade can be like this,
- SELL PRICE= CLOSE PRICE of SHOOTING STAR
- STOP LOSS = HIGH PRICE of SHOOTING STAR
- TARGET = You can set a target according to your RISK MANAGEMENT.

Example of Shooting Star Candlestick Patterns

- Let us get into the practical applicability and see if you understood the pattern. This is the chart of IRB Infrastructure, one of the leading Infrastructure companies in India.
- We can see there has been a uptrend. This is a good uptrend from June 2021 to the mid of July 2021.
- Prices start making new high and at the end of the uptrend we see a Shooting star candlestick patterns, so the first condition is a uptrend, it is satisfied.
- The second condition is the shooting star candlestick in the uptrend.
- The third condition is that next day it should open at the same level and breaks the low of shooting star candlestick patterns which is being satisfied,
- So all the conditions are satisfied and we have seen that the volume has also started rising, showing us that a reversal is imminent.
- We can easily enter the trade over here and if you have seen our previous module of the hammer candlestick patterns, we can enter the trade at the shooting star candlestick patterns and we could have exited our trade at the hammer candlestick patterns, which shows us that the reversal may occur from this hammer candle.
- Buyers may come and push the price up from this hammer candlestick patterns so its better to book some profits and trail stoploss cost to cost.
- So you can use these candles in conjunction to get a very good result of when to buy when to sell it, or when to hold.
NOTES: If you take any trade then three things can happen.
- The market can be BEARISH according to your thinking – You must do your PROFIT BOOK after seeing the right time.
- The market may be BULLISH against your thinking – and if your STOP loss is getting hit, then EXIT from TRADE.
- If the market is SIDEWAYS, you can wait and have an eye on your trade.
If you do not do this, then you are not following the technical analysis, you are doing something else, and then everything will be gambling on the basis of luck.
Disclaimer:- This is for Education Purpose Only.
Conclusion
- Shooting Star Candlestick Patterns for day trading or swing trading are usually the best trading patterns to take the trade.
- This setup is very easy and simple to use just you need to keep patience and let your setup form and then you can enter your trades.
- Stoploss should be low or high of the previous swing for uptrend and downtrend and the target would be as per your risk-reward ratio.
- One should follow the Risk Management, Money Management, and Fear and Greed concept of the market to avoid big losses.
- If you like this post kindly leave a comment in the comment section so that we can know what your thought about this Shooting Star Candlestick Patterns.
- For more trading ideas do follow us on


