
 by
by What are Price Action Strategies?
Price Action Trading Strategies is the discipline of making all of your trading decisions from a stripped down or “naked” price chart.
Price Action Strategies is taking the trades based on what the price is telling you, not based on what indicators are telling you because ultimately it is the buyers and sellers who take the market up or down.
It is not your indicator, it’s not your stochastic, it’s not you, it’s not your super trend, it’s not your RSI, not all this indicator is set to decide whether the market is going up or down. It’s all decided by buyers and sellers.
Price action is the movement of a security’s price plotted over time. Price action forms the basis for all technical analysis of a stock, commodity, or asset chart.
In trading also the price is everything if you want to become a good trader then you need to learn the price action first. Price moves up and down purely based on Buyers and Sellers.
5 Best Price Action Trading Strategies
Price Action Trading Strategies are as follows:-
123 Pattern Price Action Strategies
The 123 pattern is very famous and popular and it can build a robust foundation for price analysis.
So when we look at any price chart we usually look at trending markets in which we try to understand Trending Markets.
We can understand the 123 patterns and understand price action in the context of the 123 patterns very effectively.
In this one, I marked several prices into 123 price movements and we have talked about those where we look into the Fibonacci and Fibonacci retracement.
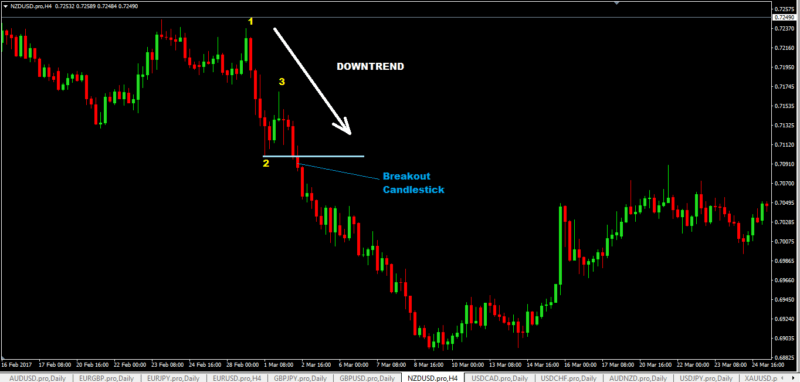
Every trend can usually be described in its initial wave and its initial form with the 123 starting points. So the new uptrend starts at the bottom then it has its first up trending leg comes to the point to and then the first retracement stops at point 3 and this is often with traders look at pullback opportunities because now is obvious that the market has made higher low and that the trend is really rolling over to an uptrend and now traders look for pullback opportunity at 3.
When I break down waves & when we break down the price to an even smaller level will be able to find 123 patterns across the bot.
So within this 1 to 2 move, we can look at the smaller price action here and you can also see 1 2 & 3 moves into the above post.
So the trader looking at granular price more movements may be able to trade this downward would like point 2 to 3.
In the bigger picture with help of the little 123 patterns so looking for a retracement here at a point 3 level may be a break or below 2.2 which is very common as well and even here on the right-hand side.
So let us assume we have a bullish and trend following today is looking to trade in the longer-term uptrend and once you have 1 to 2 pattern you wait for the point 3 to form and when is the three-point confirmed when the price starts moving away and you could either way for a price to break up after recent to the major point 2 or you can look for a small amount with 3 patterns around the point 3 in a big contact so here you can see you have 1 2 & 3 and then you can see this is what uptrend started.
So even within the bigger picture, you will be often able to find the 1 2 & 3 patterns and you will wait for the third point to form ten you could wait for a point 2 to break into a new high that is done after the trader how he likes to structure his trades & vice versa for Downtrend.
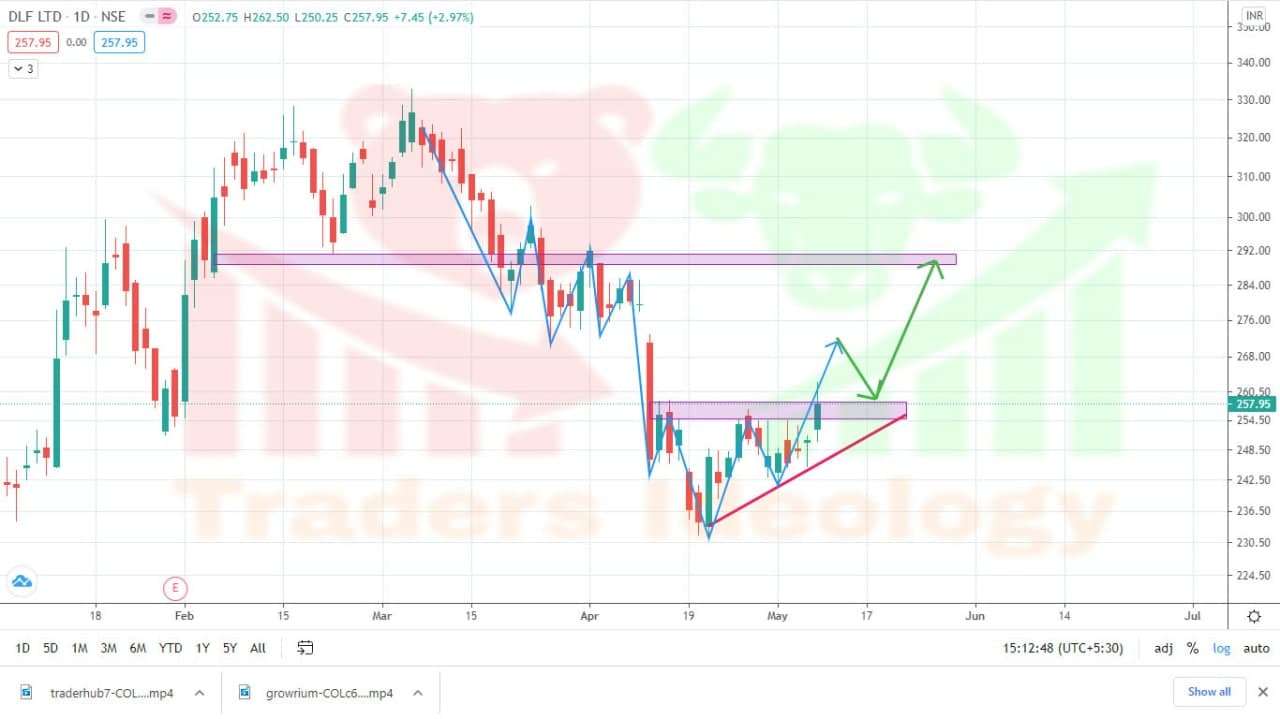
Breakup Buildup Price Action Strategies
In this pattern, we look for an established downtrend and uptrend. In this above example, we have a downtrend and you wait for a pattern to form a price action and to slow down here the bottom.
for example, you have this double top here built at the low of the pattern. So we have one swing point at High and another swing point here.
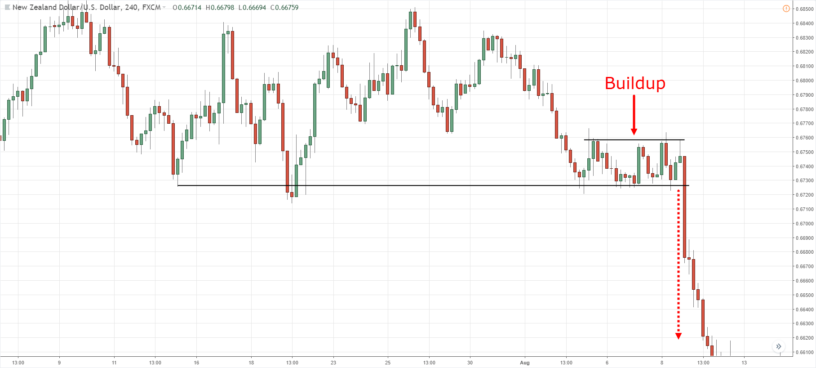
When the markets take off, this is the build-up the market is sticking to its level & is not able to break higher but more importantly it’s not able to push lower.
So not coming close to the previous low at all which already indicates more building bullish pressure and then you could go to a lower time frame and wait for the breakout to happen to time your entry and vice versa for a downtrend.
Acceleration Price Action Strategies
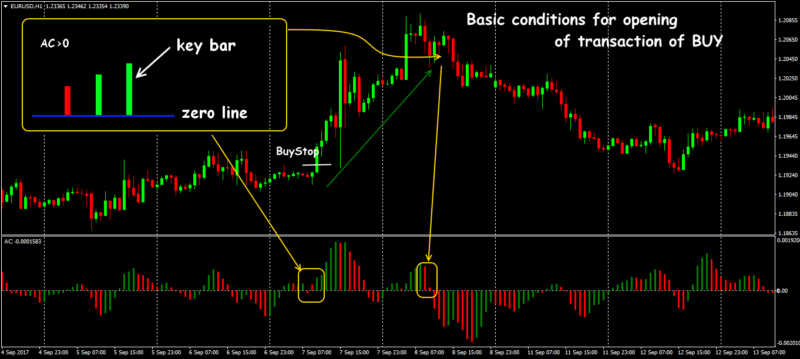
In this basically, we used to analyze price action and Momentum so you can see the market is in a downtrend the downtrend phase was over here for now then you can see that he is potential what is a bullish reversal and you can see the camels are getting longer here very very long candle with his bullish candle.
You can see here we have one two three very very small Candles. You can see after the long candle. So we can see after the long candle the momentum shifts down and has a very very small Momentum only a very very small Candle which means Deceleration.
For example, it’s like a ball when you throw up in the air it will be very quick at the beginning and as near the top of the momentum slows down and the movement becomes smaller and then here slowly rolls up & here we have pin its price bar candle and once its low gets broken then we can see a sharp fall downwards.
So this is the concept behind the de-acceleration and acceleration here we can see it t in the context of trending market so the market would be on a strong uptrend this is called in evening Star and morning star pattern these are strong candlestick Pattern leading into the top then you have a very small told you doji pin bar candle which shows you that the momentum is this de-accelerating and then on the other side the momentum is accelerating the downside.
so we can nicely follow this Momentum and we can nicely see how the momentum is turning when you look left you could also include the support and resistance area.
To make a high probable trade you can simply make your setup using support and resistance with a candlestick.
Flag Strategy
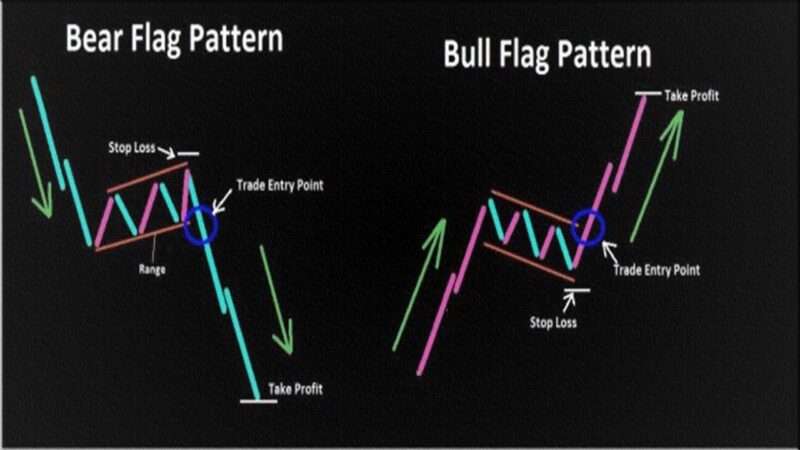
Flags are very very powerful; they are usually trending continuation patterns. So the market is in a downtrend and usually when you look at the trendings markets.
The price will not just fall in one straight line every up and down it will be back and forth and flags help you understand these back and forth patterns.
So the market was downtrend then it stopped but how did it stop very very weak so there was not a lot of interest. You can see the market here felt very quickly very strong bearish move and here the bullish move was very very weak.
There are no bulls present in the market. So we can see once the flag breaks downtrend accelerates here we have the concept of acceleration and deceleration again the bulls are not only taking over there is a very small up trending phase or a very small consolidation.
Tweezer Price Action Strategies
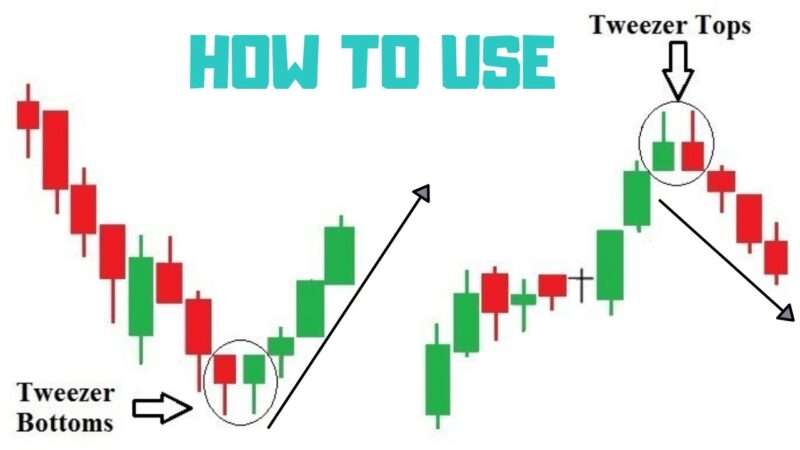
Tweezers are very famous because they are built around the pin bar patterns but Tweezer uses 2 bin bars next to each other.
In the above chart, you can see how tweezers look like you have a very strong resistance level. The market moves into the resistance level gives you one rejection candle gives you another rejection candle to very strong pin bars show the rejection of the level no momentum here no interest break higher.
So there is no bullish power behind this move and to the downside, the market accelerates and continues the bearish pressure.
Here we have a multi Top Tweezer are you can see that uptrend accelerates in the top then we have to doji bars so total we have 3 tweezers tops here which again show us that the market tries to break higher but there was not a lot of momentum behind this move so the bulls are fully convinced that they are not strong enough to move the price higher.
The possibility of going down the market slowly accelerates so we can see this concept in work over at play again and you can see that downwards movement start and it continues the downward trend.
Tweezer can be very nicely combined with other concepts and you can form a good setup for yourself.
Head and Shoulders Strategies
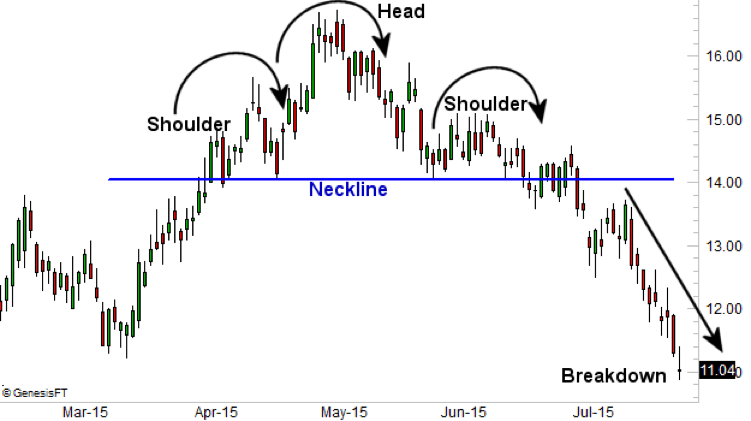
Head and Shoulders use are the best after trending markets when you are looking for a head and shoulder reversal.
On the technical analysis chart, the Head and shoulders formation occurs when a market trend is in the process of reversal either from a bullish or bearish trend; a characteristic pattern takes shape and is recognized as a reversal formation.
The Head and Shoulders pattern is a chart formation that appears as a baseline with three peaks, the outside two are close in height and the middle is highest. In technical analysis, a head and shoulders pattern describes a specific chart formation that predicts a bullish-to-bearish trend reversal.
If you like this post kindly leave a comment in the comment section so that we can know what your thought about these candlestick patterns. For more trading ideas do follow us on