
 by
by In Price Action Trading also the price is everything if you want to become a good trader then you need to learn the price action first. Price moves up and down purely based on Buyers and Sellers.
Price Action trading is the most basic form of trading strategy that teaches traders about how to read trends and historical prices.
When you come to trading as a retail trader there are two main approaches we have the fundamental approach and the technical approach.
Fundamental Approach: The underlying value of a stock market can be determined by using relevant data traders look at things like state the overall economy and specific market segments they study companies forecast, liabilities, and assets they even study the management of the companies.
Technical Approach: The fundamentals are already factored into the price of the market they instead use price action charts to determine what a market will do next.
So why do Retail Traders always do especially often lean toward technical price action trader retail traders have less access to key information than say a bank or hedge funds.
We also get the information later in most cases than those banks or hedge funds that can leave retail traders at a disadvantage there is always more to study meaning there are always more documents or financial figures that you can look at to give you a bigger picture.
Large Funds like banks and hedge funds have teams of people who look through and analyze it all whereas retail traders do not.
There is also the fact that there are different interpretations of the same information it can be difficult to determine if the earnings of a company are positive or negative. Think of how many hedge funds go bust. These are the Differences between Fundamental Tradings and Price Action Trading.
Core Concept of Price Action Trading
One of the main ways price action traders attempts to predict future price movements through the use of support and resistance.
Support and Resistance rely on the notion that areas, where people bought or sold in the past, are likely to be areas of interest again in the future.
Any markets whether it is made up of two people or millions of people simply represent buying and selling. People tend to act in predictable ways.
Example of Price Action Trading

Imagine you bought a bunch of collectible cards for 1 rupee each you hold the cards and watch the value of the cards increase which is 10 rupee.
As the value increases people are still buying them at each market price that is what is driving the price higher the cards then suddenly plummet value to 100 rupees over time.
Does the value start to increase once more as the cards start pressing towards 500 rupees what do you think now going to happen? People will start selling the cards at higher prices now the price drops from 500 rupees last time.
Now they don’t want to risk another fall they decide to book profits from their trades. You also decide to sell some of your shares.
We see this time and time again in the financial markets which means that history repeats itself in the Stock Market and it is called support and resistance.
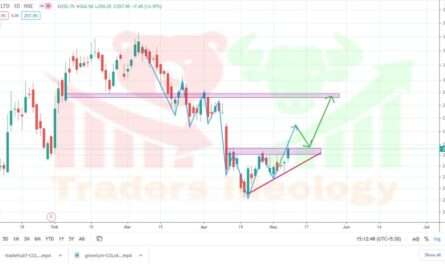
If price changes are significant its often clues for the future important levels. Here we have a chart in which we can see the market rising in price and then there is a good amount of selling now look what happens here as the market presses back up into similar levels.
The market finds resistance and the seller steps in and the market fall over and over again. Think back to collecting cards at this point there is no confidence that the price of cards can continue to increase. so there are more sellers than buyers.
At the support, we can see buyers stepping in as the market falls buyers found the value here they still believe that the price may go in an upward direction. Think of your card dropping from 500 rupees to 300 rupees.
Buyers may think that the price is going to increase up to 1000 rupees and they are now going to take a long position.
There are lots of ways price action traders analyze the markets with support and resistance being a key component of most trading plans the chart cannot lies it always shows the area where the significant buying and selling occurred.
Markets are driven primarily by people and emotion, this information can be used by price action traders.
Now Usually people say but it doesn’t happen all the time. Of course, it doesn’t it comes down to the overall perception of the market at a given time.
Price Action Traders use many Price Action Trading Strategies to determine when to buy and sell.
The candles themselves can also give clues. If we use a very simple concept of price action trading. Lots of buyers suggest more buying and lots of sellers suggest more selling. Can that help?
Resistance Levels
At resistance levels (refer to chart) red candle shows the period when the market has fallen in price the larger the red candle larger the price decline or selling pressure.
Here we identify two strong selling candles which suggest that the sellers are stepping in at the resistance levels and gives the clue that the price may fall again.
As a price action trader, we would also think if I am wrong then how would I know perhaps it could be if the price is broken previous high of the market then we need to exit our positions.
Support Levels
At Support Levels The Green candle shows the price is increasing over the period the larger the green candle larger the buying pressure.
Here we identify two strong Buying candles which suggest that the buyers are stepping in at the support levels and gives the clue that the price may increase again.
As a price action trader, we would also think if I am wrong then how would I know perhaps it could be if the price is broken the previous low of the market then we need to exit our positions.
Conclusion
Price Action Trading are usually a best trading patterns to take trade. This setup is very easy and simple to use just you need to keep patience and let your setup to form and then you can enter your positions. Stoploss should be the low of the candles and the target would be as per your risk-reward ratio. One should must follow the Risk Management, Money Management and Fear and Greed concept of market to avoid big losses.
If you like this post kindly leave a comment in the comment section so that we can know what your thought about these candlestick patterns. For more trading ideas do follow us on