In this article, we will be discussing How to trade the Bullish Engulfing candlestick pattern. I’m presuming that you’ve already read our article about the hammer, morning star, evening star, Shooting Star & Doji Candlestick Patterns. If you have not read those articles, after reading this article you can read those articles too.
Today we’ll be discussing the Bullish Engulfing Candlestick Pattern which is the most powerful candlestick pattern. It is a single candlestick pattern and it signifies that there has been a dramatic reversal in the prices. Doji is a sign of bending the ongoing trend of the market.
This is one of my favorite candlestick patterns because it tells us so much about the psychology of the buyers and the sellers and it is such an effective pattern.
What is the Engulfing Candlestick Pattern?
You need only one candle to trade in a single candlestick pattern. But today we will learn about multiple candlestick patterns. Opportunities must be found to take trades in multiple candlestick patterns, which sometimes involves identifying 2,3 candles. For that, you have to see the candle chart for the last 2 or 3 days.
When the Engulfing Pattern is formed in the chart, it takes at least 2 sessions for it. In this, the Candle is short on the first day and the candle is long on the second day. It will look in such a way that the second candle will swallow or hide the first candle. If the Engulfing Pattern is forming in the below trend, then it is called Bullish Engulfing Pattern.
And if the engulfing pattern is forming in the upward trend then it is called the bearish engulfing pattern.
Also read:
Bullish Engulfing Pattern
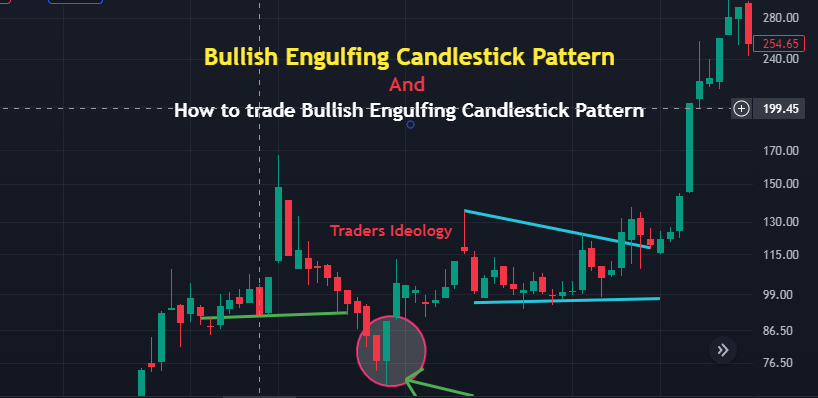
Bullish Engulfing Pattern is 2 candles that are formed in the ongoing downward trend, as soon as the Engulfing candle is formed, the market is occupied by the Bulls, which means that the market can reverse (bullish) from here and you can initiate buy positions.

In the above chart, a 2-day bullish engulfing candle is placed in a circle.
What is special about the Bullish Engulfing candlestick Pattern? What are the things to be kept in mind?
- The trend should be to the downside before a Bullish Engulfing Candlestick Pattern is formed.
- On the first day, the small candle should be of red color, from which we get the confirmation that there is a slowdown in the market.
- On the second day, the candle should be green/blue so that the first-day red candle is completely engulfed by a green candle.
Why is a Bullish Engulfing Candlestick Pattern Formed?

- The market is slowly going down.
- The engulfing pattern opens at the bottom on the first day, forming a red colored candle.
- Then the second day’s candle opens near the first day’s closing price and a new low is tried to be made but the low is overbought, due to which it closes above the previous day’s candle, and today’s closing forms a blue/green candle.
- When there is a change in the price on the second day, from which we know that the bulls have firmly occupied the market. They have slightly bullish on the bearish trend, due to which they had to put in a lot of effort, due to which the long engulfing bullish candle is green/blue in color.
- The Bears did not know that the Bulls would take any such step and that is why the Bears get a little scared of the Bulls.
- The way the market is moving fast, it remains bullish for a few days. Because of this the price keeps going up. In this, you should be looking for a buying opportunity.
How to trade in a Bullish Engulfing Pattern?

- Bullish Engulfing is formed in the full 2 days.
- The buy suggestion given in this will be equal to the close price of the blue/green candle.
- The trader taking the risk will initiate the deal on the candle formed on the second day when he gets the confirmation and will completely hide the candle on the first day.
- A risk-averse trader will trade when he sees a blue/green candle day.
- If a red candle is formed after the Bali candle on the second day, then the trader will not trade to avoid the risk. Because he cares that “buy in strength and sell in weakness”.
- According to me, multiple candlestick patterns are formed in 2 days or more, in which those taking risks remain in more profit and do not avoid risk.
- The stop loss of the trade is placed at the low of both the Bali candle on the first and second day, here you have to wait for reaching your target or stop loss, although to increase the profit, sometimes the stop loss may have to be trailed.
OHLC-
Red candle on the first day = P1 and Green Bullish Engulfing candles on the second day = P2
P1 – Open = 3510, High = 3537, Low = 3320, Close = 3375
P2 – Open = 3410, High = 3569, Low = 3313, Close = 3550
Example of Engulfing candlestick pattern?
- The risk-taking trader will buy on the day of P2 but first, he will confirm whether engulfing candle is forming or not
- At 3:20 pm on the day of P2, the current price should be higher than the open price of P1.
- On the second day, the opening of P2 should be equal to or slightly below the close price of P1 on the first day.
- The risk-averse trader will always initiate the trade on P2 the next day only when he sees a green/blue candle forming. Meaning that on P1 Tuesday, the trader who avoids the risk will do his trade on P2 on Thursday.
- Always remember one thing in multiple candles you have to let the multiple candlestick patterns complete and then deal with it.
- Your stop loss will be the lowest low between P1 and P2.

- The P1 candle should completely cover the P2 only the real body, as well as the upper and lower shadows, should also be properly covered. If this happens then we call it a Bullish Engulfing Pattern. Some people may not accept this thing.
- In General, Trade Setup can be like this:
BUY PRICE = CLOSE PRICE of Bullish Engulfing Candle.
STOP LOSS = LOW PRICE of Bullish Engulfing Candle.
TARGET = You can set the target according to your RISK MANAGEMENT.
NOTES: If you take any trade then three things can happen.
- The market can be bullish according to your thinking – You must book your profit after seeing the right time.
- The market may be bearish against your thinking – and if your stop loss is getting hit, then exit the trade.
- If the market is sideways, you can wait and have an eye on your trade.
- The most important thing is how you increase your skills and how to trade well with candlestick patterns. You have been given a chart below, in which you will be bullish engulfing pattern is made.
Conclusion
- Hammer Candlestick Pattern for day trading or swing trading is usually the best trading pattern to take the trade.
- This setup is very easy and simple to use just you need to keep patience and let your setup form and then you can enter your trades.
- Stoploss should be low or high of the previous swing for uptrend and downtrend and the target would be as per your risk-reward ratio.
- One should follow the Risk Management, Money Management, and Fear and Greed concepts of the market to avoid big losses.
- Make sure you see all our articles on candlestick patterns, so you can use them all in conjunction because you will be seeing or witnessing a lot of candlestick patterns, happening in the daily or weekly charts or hourly charts.
- If you have good knowledge of these patterns, you can take a very informed trade and you can maximize your returns.
- If you like this article kindly leave a comment in the comment section so that we can know what your thought about this Hammer Candlestick Patterns.
- I hope you understand the Hammer Candlestick Patterns of technical analysis very well.
Also Read:
- For more trading ideas do follow us on


